Summary: Climate & Latitude
BACKGROUND: The purpose of this project was to analyze how weather changes as you get close to the equator.
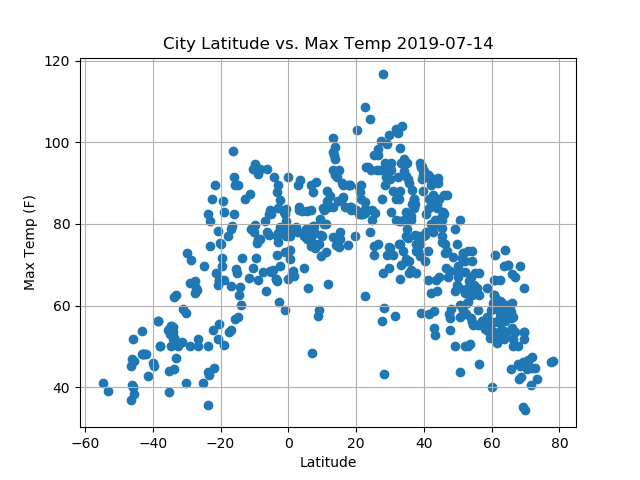
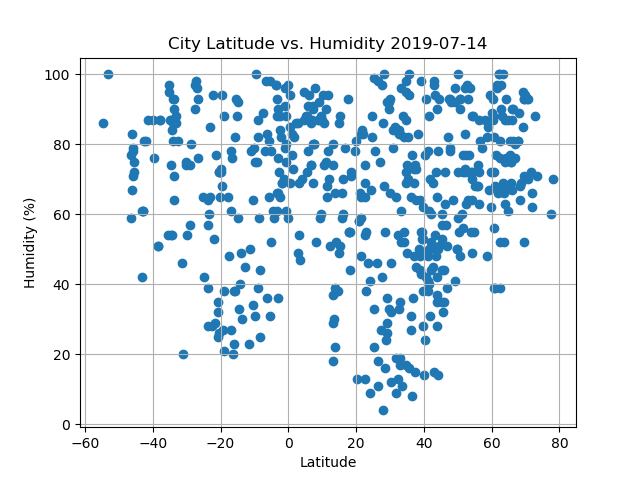
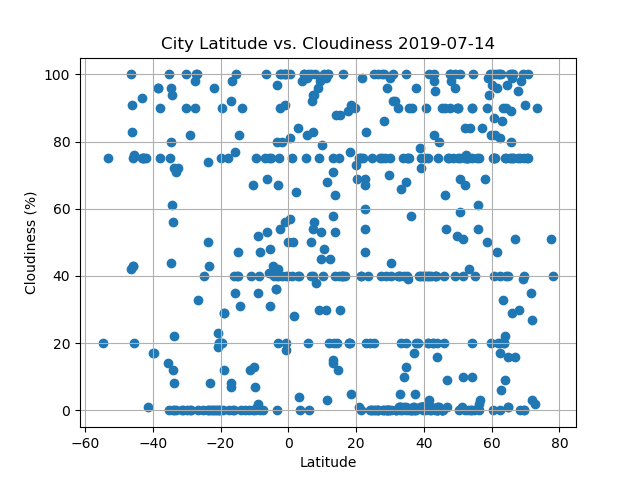
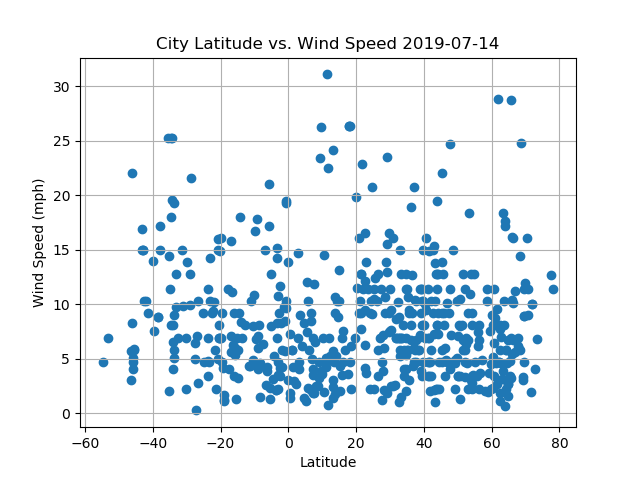
METHODOLOGY:A random list of approximately 600 (non-repeat) cities (latitude and longitudes coordinates) was created using numpy . Coordinates were translated into a list of cities using citipy and a series of successive API calls were made to the OpenWeatherMap API. Matplotlib was used to create the visualizations to the right (in clockwise order starting from the top left) for latitude vs. temperature, humidity, windspeed and cloudiness.
EXECUTIVE SUMMARY: The strongest realtionship observed was Temperature vs. Latitude. The weather becomes significantly warmer as one approaches the equator (0 Deg. Latitude). Of note the northern hemisphere (positive latitude) tends to be warmer (at the time of this analysis - June) than the southern hemisphere. One explaination notes: This is because the Southern Hemisphere has significantly more ocean and much less land. Since water heats up and cools down more slowly than land the Southern Hemisphere is cooler.


